An Isohyet map like the one above has lines that show equal levels throughout the map. Generally this type of map refers to water levels and precipitation.
http://www.vistadatavision.com/index.php?page=wind-rose
This is a wind rose that is commonly used by meteorologists to view wind speed and the direction it is traveling. These use to be very common on older maps but arte no longer actively used except by meteorologists.
http://www.weathernotebook.org/images/winter/3.jpg
This isopleth map is very similar to a chloropleth map. The contour lines depict variables that can’t normally be measured at a point, but uses the data collected in the area to make calculations.
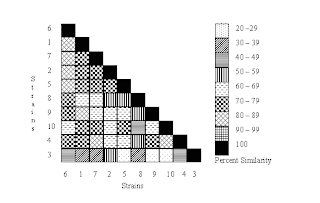
This is a similarity matrix that compares the percent similarity between random strains in a scientific study. This type of map is very useful in scientific studies comparing similar yet different variables.


