Saturday, April 23, 2011

Isopach

http://www.nvcc.edu/home/cbentley/gol_135/massanutten/massanutten.htm

This map is an isopach because it shows the variation of thickness within the lines or units.

Isohyets


 An Isohyet map like the one above has lines that show equal levels throughout the map. Generally this type of map refers to water levels and precipitation.


http://www.scoop.co.nz/stories/AK0808/S00090.htm

Isotachs


http://www.ametsoc.org/AMSedu/dstreme/images/ua_300w.gif
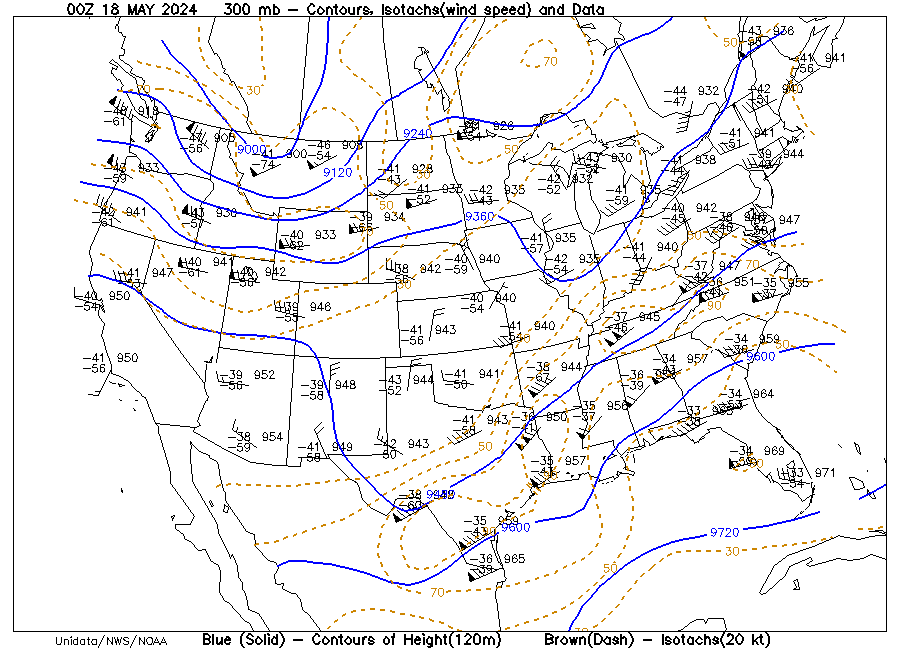
This is an isotach map that portrays data of wind speed across the US.

Correlation Matrix

http://www.biomedcentral.com/content/figures/1471-2164-8-353-5-l.jpg
This correlation matrix shows two random variables being compared to reveal data.

Wind Rose

http://www.vistadatavision.com/index.php?page=wind-rose
This is a wind rose that is commonly used by meteorologists to view wind speed and the direction it is traveling. These use to be very common on older maps but arte no longer actively used except by meteorologists.

Isopleths

http://www.weathernotebook.org/images/winter/3.jpg
 This isopleth map is very similar to a chloropleth map. The contour lines depict variables that can’t normally be measured at a point, but uses the data collected in the area to make calculations.

Similarity Matrix

 
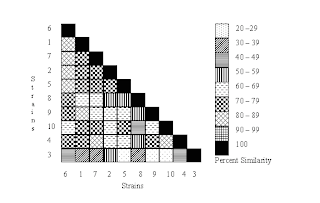
This is a similarity matrix that compares the percent similarity between random strains in a scientific study. This type of map is very useful in scientific studies comparing similar yet different variables.

Stem and Leaf Plot

http://mdk12.org/instruction/curriculum/mathematics/graph_stem.html

 This is a basic stem and leaf plot that displays that data of the height of students in a given school class. This type of mapping is useful in displaying data on a large group measuring the same factor.

Box Plot

http://www.processtrends.com/images/temp_stock_box_plot.gif
This is a box plot that displays the mean annual temperature by decade. This type of map like many of the others on this blog is useful for displaying data over time.    

Histogram

http://www.cyber-wit.com/gallery_histogram.html
This is a histogram that shows the comparison of statistics between the grades in the class and the number of students who received these grades.

Isobars

http://www.wrh.noaa.gov/slc/projects/Dec2526snow2.htm
This is an isobar map because of the lines drawn on a weather map connecting points of equal pressure. This map is of the western united states and shows the pressure in the area.

Parallel Coordinate Graph

http://vis.lbl.gov/Vignettes/Drosophila/index.html
This is a parallel coordinate graph that portrays a view of 9 cells and selected genes for a study portrayed on the website.

LIDAR

http://rst.gsfc.nasa.gov/Sect8/Sect8_8.html
 This is a map of lower Manhattan New York in LIDAR. This optical remote sensing technology is not only useful when wishing to view the city as above, but it is also used by police force with their radar guns.

Triangular Plot

http://en.wikipedia.org/wiki/File:Flammability_diagram_methane.png
This is a triangular plot because it depicts the ratios of three variables. The variables represented in this map are oxygen, nitrogen, and methane. It also shows how the percentages and mixtures of these three can result in flammable mixtures.

Doppler Radar

http://www.noaanews.noaa.gov/stories2004/s2311.htm

 As many people would commonly recognize this is a Doppler radar of a hurricane. This type of map is very common on the weather channel and very known in Florida where we have hurricanes very often in the season.

Climograph

http://www.colorado.edu/geography/extra/geogweb/bouldercreek-2/preview/page2.html

This is a climograph that shows the temperature to precipitation comparison for the city of Boulder, Colorado. This a great example for this type of map as it is a graph that adequately represents the climate of the city.

Population Profile

http://www.populationaction.org/Publications/Reports/The_Shape_of_Things_to_Come/Chapter_Six_Subtypes_and_a_Speculative_Structure.shtmlThis is a population profile because it shows the population of immigrants migrating to the U.S. and it goes on to further profile them by their age at the time of migration.

Cartographic Animations

http://maps.unomaha.edu/AnimArt/ActiveLegend/Peterson.html
This is a cartographic animation because it is a digitally produced map displaying the cancer deaths by bounty in Nebraska in relation to the average deaths from cancer.

Scatter Plot

http://onlinestatbook.com/chapter4/pearson.html

This scatter plot shows the distribution of age between husband and wife couples. This is a scatter plot because it reveals data comparisons on a graph using dots.

Statistical Maps

http://seattlebubble.com/blog/2006/09/11/mapping-housing-market-health/
This is a statistical map because it displays the statistics of a certain location or locations. This map of the US shows the income drops and increases in the US with emphasis of the article being the dramatic losses faced in the state of Michigan.